

Document Type
Book
Files
Download Full Text (17.9 MB)
Description
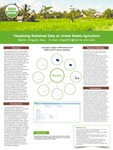
Food is essential to life. The United States Department of Agriculture (USDA) plays an indispensable role in ensuring people have access to healthy food. However, the data on the USDA website is not easy to access. Users must download many files to get data about animals, crops, the weather, and so on. To make the data more accessible to the general public, I built a web-based application to help make the data easy to access, explore, and compare. My application integrates multiple datasets from USDA website to provide graphic visualizations that enable users to get the exact, specific data intervals and information they want. Moreover, viewers can fully understand the trends of different types of crop yields in last decade and the factors behind those trends by interactively manipulating the information that interests them. To be specific, viewers can easily access and compare the crop yields according to different kinds of crop, state, and year. My research enables users to visualize and interact with many datasets instead of downloading all of them. The achievement of the research is not only to provide the convenience to interact and get specific crop yields tendency, but also explain the reasons behind these trends.
Publication Date
4-14-2018
Keywords
Information visualization; Agriculture--United States--Statistics; United States. Department of Agriculture--Statistics
Disciplines
Applied Statistics
Recommended Citation
Xiao, Xingyao, "Visualizing Statistical Data on United States Agriculture" (2018). Undergraduate Research Symposium 2018. 4.
https://digitalcommons.morris.umn.edu/urs_2018/4
Primo Type
Conference Proceeding
Comments
View the outcome of the project here: http://seq.morris.umn.edu:3838/studentwork/xingyaoxiao/